Solar Manager Manager Flux SM-1118-01
Solar system mounting material

Solar panels on the roof of our house cut our electricity bill. This is ensured, among other things, by a small control device and an app. My Solar Manager is the unsung hero of my very own energy transition.
This is part 1 of a series of articles on how photovoltaics and smart controls can reduce your electricity consumption at home. You can find the other articles in the series below.
A good two years ago, we decided as a family to take steps to reduce our CO₂ emissions. As homeowners, we were able to have 27 solar modules installed on the roof. This means the system achieves an output of 9.45 kWp. This kilowatt peak figure represents the maximum electrical output of the photovoltaic system. In practice, however, it’s not as important to me that the sun gives me a maximum of just under 9,500 watts of power. What I care about is how many kilowatt hours (kWh) it generates. Because otherwise I’d have to pay over 30 cents per hour to the Zurich Electricity Works (EKZ) as the monopoly provider in our area. At the start of 2024, the price had risen by around 50 per cent (article in German).
This makes it even more worthwhile to generate and use your own solar power rather than buying it. A solar calculator, which is available for free (in German), provides a forecast for the annual electricity generated on our roof. To use it, I need to know a few things: my address (not exactly difficult), the number of residents in the house and information about the heating (feasible), roof pitch and orientation (more difficult). The theoretical result is that the system on our roof will generate over 8,000 kWh of solar power per year.
We had our system installed without electricity storage. This means that in the brighter half of the year – from late March to late September – we produce more electricity than we use. During the rest of the year, we receive more electricity from our local provider than we generate ourselves. From this, the solar calculator can determine to what extent we are self-sufficient and what proportion of the electricity we produce ourselves we use in the house.
This self-consumption share determines how quickly a photovoltaic system pays for itself. So, the goal is to increase this value as much as possible. And this is where the black box that was placed in the power box when the system was installed comes into play.

Solar Manager Manager Flux SM-1118-01
Solar system mounting material
Hans Fischer was one of the people who invented and developed the Solar Manager in 2020. The qualified electrical engineer lives in Aargau in a house with a solar system on the roof. At some point, he started to want to know how much electricity was being produced, where it was being used and whether the electricity flows could be optimised. (You can find out more about the company history here (website in German).)
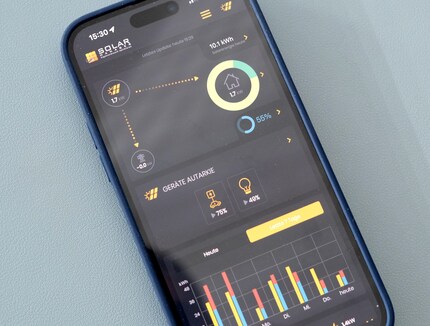
Today, there’s an app for Solar Manager users that provides this information at any time and visualises it in diagrammes.

This visualisation of real-time electricity production and consumption awakened our family’s playful side. We start the dishwasher when the sun shines and provides free electricity. The e-bike’s charged when more electricity comes from the roof than the house is currently using.
Ultimately, however, these aren’t the big ways to increase the consumption of your own electricity, as Hans Fischer explained to me in an interview: «The three big consumers are a heat pump, a boiler and an electric car.» We have all three.
Solar Manager already ensures optimised charging for our electric car i.e. via solar power when it’s available. The app’s configured so that every kilowatt hour we don’t need in the house flows into the car’s battery via the wallbox. On a normal summer’s day, this can easily be between 20 and 30 kWh. On a sunny weekend, the system on the roof usually produces more electricity than the car can charge to the battery.
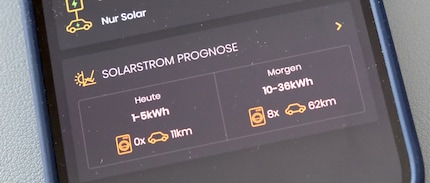
The Solar Manager app even provides a forecast of expected solar power production for today and tomorrow. The kWh is then converted into the range of the electric car and the number of cycles the washing machine could run. It’s a lot. In the summer, we could probably run a launderette.

Because our photovoltaic system went into operation at the end of 2021, we’ve been able to put together a balance sheet for 2022 and 2023. Here’s what we used:
We were able to cover just over 36 per cent of our electricity needs with our own solar power plant on the roof. The graphic on the electricity production page looks like this:
At 8,958 kWh, the system even generated slightly more electricity for 2022 than predicted in the theoretical calculation. And a little more than we used in total. We used 37 per cent of the electricity generated in the house or to charge our electric car. On the other hand, 5,655 kWh went back into the grid, for which the local electricity provider even paid us. In 2023, the sun shone a little less and sales to the EKZ fell because we used about the same amount of electricity as in the previous year.
But isn’t there more to the story? Didn’t Hans mention heat pumps and boilers? We speak again on a video call and make a plan. We should increase consumption of our own power. To do this, we’ll upgrade our boiler and heat pump. And we could still work on the visualisation, he says, making it even clearer where in the house the most energy is needed and used.
In the second part of the series, you’ll find out how Hans found an unusual electricity consumer during a visit, and why I’ll only be heating water at night in future. Follow me to make sure you don’t miss the rest of the series.
Journalist since 1997. Stopovers in Franconia (or the Franken region), Lake Constance, Obwalden, Nidwalden and Zurich. Father since 2014. Expert in editorial organisation and motivation. Focus on sustainability, home office tools, beautiful things for the home, creative toys and sports equipment.
Interesting facts about products, behind-the-scenes looks at manufacturers and deep-dives on interesting people.
Show all
Background information
by Martin Jungfer

Background information
by Martin Jungfer

Background information
by Patrick Vogt