
Ryzen 9 3950X: What can the new 16-core beast from AMD do?
The Ryzen 9 3950X is the first consumer processor to have 16 cores. What are 16 cores good for and aren't 12 cores enough, like the Ryzen 9 3900X? I pit the 12-core Ryzen 9 3900X against the 16-core Ryzen 9 3950X and tell you for whom the larger model is worthwhile.
What a year for AMD: With the third generation of Ryzen processors, the chip developer has finally caught up with Intel. In terms of single-core performance, it's still not enough for the throne, but it is in terms of cores. With the Ryzen 9 3950X, AMD has gone one better: 16 cores are a first for consumer processors.

The chip in detail
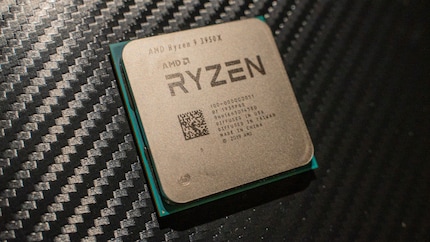
The Ryzen 9 3950X has a 3.5 GHz base clock and a 4.7 GHz boost clock. Like the other Ryzen 3000 processors, it is equipped with a mixture of faster and slower cores. In contrast to the 3900X, the 3950X has a 100 MHz higher boost clock.
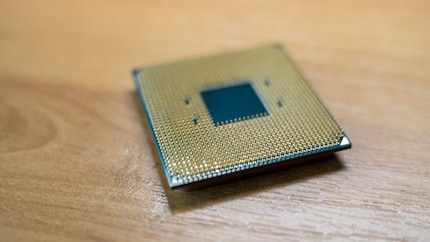
The TDP of the 3950X is 105W TDP, just like the 3900X. It is equipped with 64 MB L3 cache and 24 PCIe Gen 4.0 lanes. Where AMD specifies 100 MHz more for the boost clock, the base clock is 300 MHz with 3.5 GHz less than the Ryzen 3900X.
The 3950X has an AM4 socket and fits on X570, X470 and B450 motherboards. For older boards, it is advisable to ensure that the motherboard has a sufficient power supply. An update to AGESA version 1.0.0.0.4B is also required.
| Processor | Microarchitecture / manufacturing process | Cores / Threads | Base / boost clock (GHz) | TDP (Watt) | L3 cache (MB) | PCIe Lanes | Memory Support |
|---|---|---|---|---|---|---|---|
| Ryzen 9 3950X | Zen 2 / 7 nm | 16 / 32 | 3.5 / 4.7 | 105 | 64 | 24 Gen 4 | Dual-channel DDR4-3200 |
| Ryzen 9 3900X | Zen 2 / 7 nm | 12 / 24 | 3.8 / 4.6 | 105 | 64 | 24 Gen 4 | Dual-channel DDR4-3200 |
Test methodology
I base my test methodology on that of our graphics cards. I therefore carry out the same tests for the most part. In the Blender benchmark, however, I run the CPU benchmark, which only renders with the CPU. I also run Cinebench R20 and transcode a 1080p film with Handbrake.
The two processors are tested on our DimasTech Easy V3.0 Benchtable with the following components:
Contrary to AMD's recommendation to cool the 3950X with water, I tested with the standard AMD fan that came bundled with the 3900X.
Synthetic benchmarks and temperatures
Cinebench R20
With Cinebench from Maxon, you can test how your PC or processor performs when rendering Cinema 4D content. Here are the results of the two processors in comparison.
| Processor | Multi Core Score | Single Core Score |
|---|---|---|
| Ryzen 9 3950X | 8730 | 510 |
| Ryzen 9 3900X | 6906 | 505 |
The Ryzen 9 3950X achieves the better result than the Ryzen 9 3900X in both Single and Multi Core. However, the five points in the single core are negligible, they are within the error rate of benchmarks. Thanks to the additional four cores, the 3950X achieves 1824 points more than the 3900X. The benchmarks will show what these 1824 points amount to.
Fire Strike and Time Spy
Here are the results of the Time Spy and Fire Strike benchmarks.
| Benchmark | Overall Score
3950X / 3900X | Physics / CPU Score
3950X / 3900X | Combined Score
3950X / 3900X |
|---|---|---|---|
| Fire Strike
(1080p, DirectX 11) | 24 929 / 22 467 | 31 526; 100.08 FPS / 27 072; 85.94 FPS | 12 549; 58.37 FPS / 9024; 41.98 FPS |
| Fire Strike Ultra
(2160p, DirectX 11) | 6821 / 6645 | 31 424; 99.76 FPS / 28 337; 89.96 FPS | 3676; 17.1 FPS / 3571; 16.61 FPS |
| Time Spy
(1440p, DirectX 12) | 11 556 / 11 428 | 11 435; 38.42 FPS / 11 277; 37.89 FPS | n/a |
| Time Spy Extreme
(2160p, DirectX 12) | 5590 / 5401 | 8045; 43.5 ms frametime / 6473; 54.1 ms frametime / | n/a |
The Ryzen 9 3950X dries up the 3900X in every benchmark. In Firestrike it is 10 to 15 FPS more. In Time Spy, the difference is not so enormous because the CPU plays a lesser role.
In terms of temperatures, the two processors balance each other out. In both Fire Strikes, they are within two degrees Celsius, with the 3900X getting hotter on one occasion and the 3950X on the other. The maximum temperatures are between 70° and 77° Celsius.
Time Spy shows a different picture: The 3950X is between 9° and 15° Celsius cooler at maximum. That surprises me. I would have expected the 3950X to be hotter. The maximum was just under 75° and the 3900X just under 90° Celsius.
Applications
Puget Systems Photoshop benchmark
The Photoshop benchmark uses the following reference workstation as the basis for calculating the scores:
- Intel Core i9 9900K 8 Core
- NVIDIA GeForce RTX 2080 8GB
- 64GB RAM
- Samsung 960 Pro 1TB
The results of the reference workstation can be used to estimate how well other systems perform. The two processors achieve the following results
| Scores | Ryzen 9 3950X | Ryzen 9 3900X | Reference workstation |
|---|---|---|---|
| Overall Score | 953.4 | 913.4 | 1000 |
| General Score | 95.7 | 87.1 | 100 |
| Filter Score | 92.5 | 94 | 100 |
| Photomerge Score | 100.3 | 94.5 | 100 |
| GPU Score | 94.5 | 97.6 | 100 |
In the Photoshop benchmark, the Ryzen 9 3950X overall scores around five per cent more points than the 3900X. The result would have been even better if the graphics card had performed as well as the 3900X in the benchmark. Otherwise, the 3950X achieves better results across the board than the 3900X. However, the 3950X does not come close to the reference workstation. This may also be due to the fact that our test benchmark is only equipped with 16 GB RAM.
Puget Systems Premiere benchmark
In contrast to the Photoshop benchmark, our test benchmark does not compete against a reference workstation. In the Premiere benchmark from Puget Systems, the score is calculated relative to the frame rate of the test videos. If the test video has an FPS of 29.97 and the system renders it at 29.97 FPS, this means 100 points. If it is only 14.98 FPS, there are also only 50 points.
The benchmark runs media in the formats 4K H.264 with 150 Mbps in 8 bit (59.94 FPS), 4K ProRes 422 16 bit (59.94 FPS) and 4K RED (59.94 FPS). He tested live playback in Adobe Premiere Pro and the export. A value of 100 is the maximum for live playback, as Premiere cannot play back the media faster than specified. For export, on the other hand, over 100 points are feasible, as rendering is not limited to the FPS of the media.
In addition, effects are added to ten ProRes 422 clips, which place a heavy load on the graphics card. Puget Systems calls this "4K Heavy GPU Effects". These clips are then played back in Premiere and exported. The same happens with Heavy CPU Effects, with effects that place a heavy load on the CPU. The CPU value is particularly relevant for the Ryzen comparison. I have nevertheless listed the GPU values for the sake of completeness.
Here are the results of the two Ryzen processors.
| Test | Ryzen 9 3950X | Ryzen 9 3900X |
|---|---|---|
| Overall Score | 695.5 | 668.5 |
| Live playback score | 71 | 69.4 |
| Export Score | 68.1 | 64.3 |
| 4K H.264 with 150 Mbps in 8 bit (59.94 FPS) | 55 Live Playback Score
99 Export Score | 56 Live Playback Score
91 Export Score |
| 4K ProRes 422 16 bit (59.94 FPS) | 99 Live Playback Score
100 Export Score | 99 Live Playback Score
93 Export Score |
| 4K RED (59.94 FPS) | 66 Live Playback Score
85 Export Score | 58 Live Playback Score
71 Export Score |
| 4K Heavy GPU Effects | 79 Live Playback Score
48 Export Score | 79 Live Playback Score
48 Export Score |
| 4K Heavy CPU Effects | 55 Live Playback Score
20 Export Score | 56 Live Playback Score
20 Export Score |
The Ryzen 9 3950X achieves the better scores than the Ryzen 3900X. The effective differences are negligible, except for 4K RED. In Premiere, the 3950X does not give you noticeably more than the 3900X, unless you are working with RED files.
Puget Systems after-effects benchmark
In the Puget Systems After Effects benchmark, the benchmark scores are structured similarly to Photoshop. The following reference workstation serves as the basis for calculating the scores:
- Intel Core i9 9900K
- 128 GB RAM
- NVIDIA GeForce RTX 2080 8GB
The results of the reference workstation can be used to estimate how well other systems perform. Our test benchmark achieves the following results:
| Scores | Ryzen 9 3950X | Ryzen 9 3900X | Reference workstation |
|---|---|---|---|
| Overall Score | 1007 | 900 | 990 |
| Render Score | 103.1 | 98.3 | 98.7 |
| Preview Score | 97.4 | 92.9 | 99.3 |
| Tracking score | 101.6 | 78.7 | 100.2 |
The 3950X makes a mess of the 3900X and the reference workstation. Only in the preview score does the reference workstation achieve a better value than the 3950X. This could be due to the fact that the preview is more dependent on the single core performance than the multi core. The 3950X is vastly superior to the 3900X. The 3950X delivers over 10 per cent more performance. As I already mentioned in the review of the 2080 Super from KFA2, the 3900X in combination with the 2080 Super drops in the tracking score for reasons I can't explain. The problem does not exist with the 3950X.
Puget Systems Resolve Benchmark
The scores of the Resolve benchmark from Puget Systems are also based on a reference workstation. To determine the scores, codecs are rendered in 4K. The reference workstation is based on the following components:
- Intel Core i9 9900K
- A minimum of 32 GB RAM (not mentioned by Puget Systems)
- NVIDIA Titan RTX 24GB
In the 4K benchmark, the two processors achieve the following results.
| Format | Ryzen 9 3950X | Ryzen 9 3900X | Reference workstation |
|---|---|---|---|
| 4K Average Results Overall Score | 932 | 947 | 1000 |
| 4K H264 150 Mbps 8 bit Codec Average Score | 93.2 | 93.6 | 100 |
| 4K Cinema Raw Light | 95.7 | 96.6 | 100 |
| 4K ProRes 422 | 90.9 | 95.9 | 100 |
| 4K ProRes 4444 | 90.2 | 93.6 | 100 |
| 4K RED | 95.9 | 93.9 | 100 |
In every format - except 4K RED - the Ryzen 9 3900X performs better than the 3950X. Apart from the 4K ProRes formats, the differences are marginal. I cannot say conclusively whether the difference is due to benchmark deviations, whether Resolve does not become more powerful above a certain number of cores or whether the higher base clock of the Ryzen 9 3900X is responsible for the better results. It may be a combination of all these points. The fact is: With Resolve, it doesn't matter much whether you're working with a Ryzen 9 3900X or 3950X.
Handbrake
To compare the performance of the Ryzen 9 3900X and 3950X, I transcode the film "Drive". The source file is a 19 GB H.264 file. I select the "HQ 1080p30 Surround" preset in Handbrake and transcode the film with both processors.
The 3950X takes 26 minutes and 33 seconds to transcode. The Ryzen 3900X is 2 minutes and 35 seconds slower. This equates to around nine per cent more performance.
Blender
The Blender benchmark renders seven different scenes: Barbershop Interior, BMW27, Classroom, Fishy Cat, Koro, Pavilion Barcelona and Victor. The benchmark tests either the CPU or GPU. For the Ryzen comparison, I run the CPU benchmark. The times required per scene are recorded and totalled. Here are the results.
| **Rendered scene | Required time Ryzen 9 3950X | Required time Ryzen 9 3900X |
|---|---|---|
| Total | 31 minutes 25 seconds | 40 minutes 1 second |
| Barbershop Interior | 10 minutes 45 seconds | 14 minutes 1 second |
| BMW 27 | 2 minutes 1 second | 2 minutes 38 seconds |
| Classroom | 6 minutes 39 seconds | 8 minutes 38 seconds |
| Fishy Cat | 2 minutes 59 seconds | 3 minutes 51 seconds |
| Koro | 4 minutes 10 seconds | 5 minutes 19 seconds |
| Pavilion Barcelona | 4 minutes 50 seconds | 6 minutes 12 seconds |
The Blender benchmark reveals the true qualities of the 16-core. The 3950X leaves the 3900X far behind: the new processor renders over eight and a half minutes faster.
Virtual reality
When it comes to VR, I'm still looking for a programme to test games myself. Unfortunately, Nvidia's FCAT VR doesn't work for us. So here are the results from VRMark and Superposition from Unigine. These benchmarks can be used to find out whether and how well VR gaming is possible on the system in question.
| Benchmark | Ryzen 9 3950X | Ryzen 9 3900X |
|---|---|---|
| VRMark Orange Room | 12 525
Points required: 5000 | 12 864
Points required: 5000 |
| VRMark Cyan Room | 11 483
Points required: 3088 | 11 504
Points required: 3088 |
| VRMark Blue Room | 3724
Points required: 2972 | 3687
Points required: 2972 |
| Superposition VR Maximum
Oculus Rift | 10 000
FPS: min 81.9, avg. 133.18, max. 188.95 | 10 000
FPS: min. 81.51, avg. 133.03, max. 186.82 |
| Superposition VR Maximum
HTC Vive | 10 000
FPS: min. 83.58, avg. 142.73, max. 212.38 | 10 000
FPS: min. 86.27, avg. 144.13, max. 215.91 |
| Superposition VR Maximum
HTC Vive Pro | 10 000
FPS: min. 81.72, avg. 133.67, max. 188.26 | 10 000
FPS: min 81, avg. 132.67, max 190.23 |
With VR, it doesn't matter whether you have a Ryzen 9 3950X and 3900X. Both perform about equally well. With both processors, in combination with an RTX 2080, you are also equipped for the future of VR.
The games
Last but not least, our four game benchmarks. In addition to the average, minimum and maximum FPS, I also provide you with the average frame time.
| Games | Ryzen 9 3950X | Ryzen 9 3900X |
|---|---|---|
| «Crysis 3» (DX11)
FPS 1080p, höchste Presets | min. 46.7, durchschn. 59.8, max. 118.8
Frametime: 16-18 ms | min. 50.4, durchschn. 96.7, max. 155.7
Frametime: 8-10 ms |
| «Crysis 3» (DX11)
FPS 1440p, höchste Presets | min. 55.6, durchschn. 59.7, max. 60.8
Frametime: 17-19 ms | min. 38.7, durchschn. 50.6, max. 77.5
Frametime: 18-20 ms |
| «Crysis 3» (DX11)
FPS 2160p, höchste Presets | min. 4.9, durchschn. 50.7, max. 61.5
Frametime: 20-22 ms | min. 22.2, durchschn. 27.8, max 37.3
Frametime: 26-28 ms |
| «Control» (DX11)
FPS 1080p, höchste Presets | min. 59.1, durchschn. 113, max. 242.8
Frametime: 7-9 ms | min. 56.4, durchschn. 108.5, max. 124.7
Frametime: 8-10 ms |
| «Control» (DX11)
FPS 1440p, höchste Presets | min. 53.1, durchschn. 59.5, max. 60.6
Frametime: 16-18 ms | min. 50.7, durchschn. 55.5, max. 63.2
Frametime: 17-19 ms |
| «Control» (DX11)
FPS 2160p, höchste Presets | min. 21.7, durchschn. 49.8, max. 242.7
Frametime: 31-34 ms | min. 31.2, durchschn. 34.7, max. 401
Frametime: 32-34 ms |
| «Control» (DX12)
FPS 1080p, höchste Presets, Raytracing Maximal | min. 31.3, durchschn. 51.7, max. 61.4
Frametime: 18-20 ms | min. 52.5, durchschn. 58.4, max. 66.9
Frametime: 16-18 ms |
| «Control» (DX12)
FPS 1440p, höchste Presets, Raytracing Maximal | min. 28.8, durchschn. 37.9, max. 60.1
Frametime: 28-30 ms | min. 23.4, durchschn. 31.9, max. 62.4
Frametime: 30-32 ms |
| «Control» (DX12)
FPS 2160p, höchste Presets, Raytracing Maximal | min. 16, durchschn. 19, max. 21.9
Frametime: 50-60 ms | min. 17.3, durchschn. 19.8, max. 47.4
Frametime: 34-36 ms |
| «Shadow of the Tomb Raider» (DX12)
FPS 1080p, höchste Presets | min. 70.7, durchschn. 119.1, max. 186.4
Frametime: 6-8 ms | min. 96.4, durchschn. 122.4, max. 180.4
Frametime: 7-9 ms |
| «Shadow of Tomb Raider» (DX12)
FPS 1440p, höchste Presets | min. 67.5, durchschn. 99.1, max. 164.2
Frametime: 9-11 ms | min. 63.2, durchschn. 81.4, max. 97.4
Frametime: 14-16 ms |
| «Shadow of Tomb Raider» (DX12)
FPS 2160p, höchste Presets | min. 24.9, durchschn. 54.4, max. 167.3
Frametime: 18-20 ms | min. 50.2, durchschn. 57.3, max. 68.7
Frametime: 17-19 ms |
| «Strange Brigade» (Vulkan)
FPS 1080p, höchste Presets | min. 193.8, durchschn. 225.3, max. 267.9
Frametime: 6-8 ms | min. 177.5, durchschn. 263.1, max. 311.7
Frametime: 4-6 ms |
| «Strange Brigade» (Vulkan)
FPS 1440p, höchste Presets | min. 165.7, durchschn. 182.2, max. 229
Frametime: 6-8 ms | min. 108.4, durchschn. 123.7, max. 147.8
Frametime: 7-9 ms |
| «Strange Brigade» (Vulkan)
FPS 2160p, höchste Presets | min. 79.2, durchschn. 91.6, max. 112.7
Frametime: 10-12 ms | min. 84.8, durchschn. 96.1, max 114.8
Frametime 10-12 ms |
The games show that the Ryzen 9 3950X is less fast than the Ryzen 3900X in processes that only require one core. Games tend to require fewer cores and the 3900X can offer more performance here.
There were only really big differences with Crysis. I can't explain how they came about. I always play the same scenes for better comparability. It's a mystery to me why the Ryzen 3950X drops so much in 1080p but performs so well in 1440p and 2160p. The results also seem a little strange in other respects. Sometimes the 3900X is ahead and then again the 3950X. Do you have any idea how the different results come about? Then please write it in the comments column.
Conclusion: Particularly interesting for heavy core users
In Photoshop, After Effects, Handbrake and Blender, the Ryzen 9 3950X achieves between five and just over ten per cent better performance than the 3900X. In VR, Premiere and Resolve, the difference is negligible. In Resolve and certain games, the 3900X is even slightly ahead.
Overall, the 3950X is certainly interesting for CAD artists, graphic designers, people who have a lot of rendering tasks to do and video producers. However, the difference to the 3900X is not the same in all applications. It's worth taking a closer look at what you actually need your PC for.
I can't yet give a clear purchase recommendation, as I don't yet know the price here. According to the AMD presentation, the price in the USA (excluding tax) is 749 US dollars. The 3900X costs 499 US dollars (also excluding tax). That's a hefty surcharge that doesn't pay off for everyone. If you have the money, then buy the 3950X. If you're on a budget, you'll definitely be happy with the 3900X.
From big data to big brother, Cyborgs to Sci-Fi. All aspects of technology and society fascinate me.
